Chats Dashboard
Via the "Chats" tile, you get insight into the total API costs of the current month.
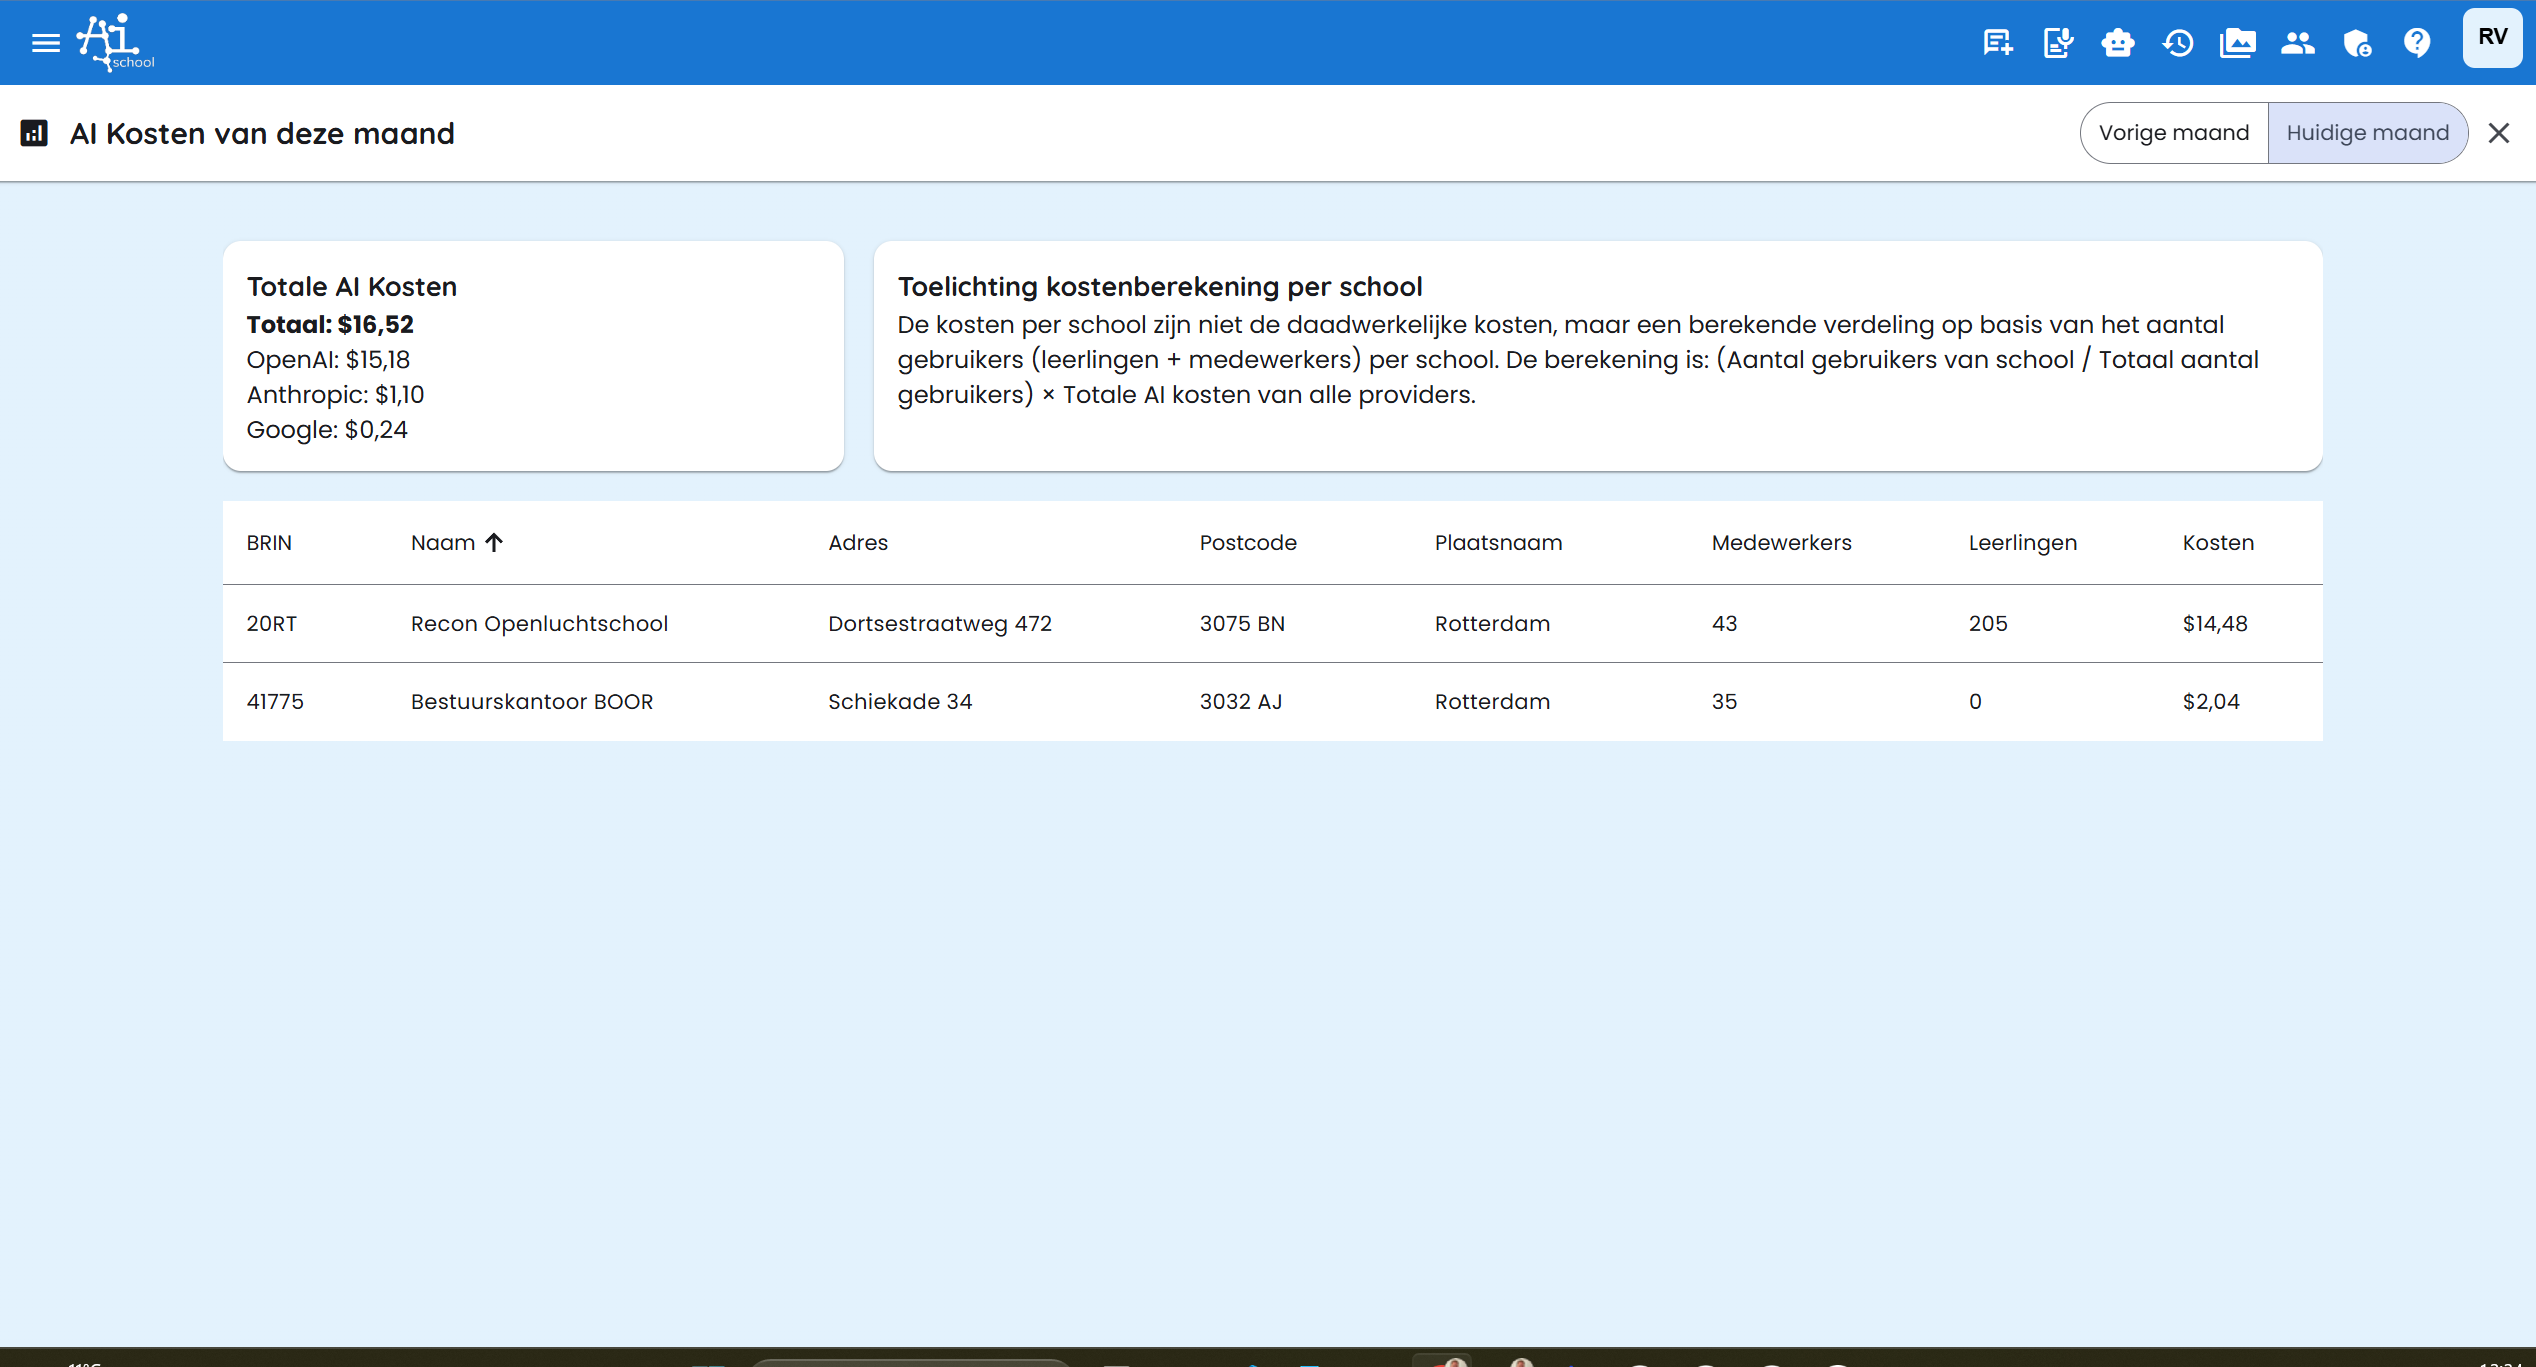
Dashboard Explanation
The dashboard shows an overview of the AI costs per school for the current month. You see the costs broken down by provider:
- OpenAI: Costs for GPT models and DALL-E image generation
- Anthropic: Costs for Claude models
- Google: Costs for Gemini models
View Previous Month
At the top of the dashboard, you'll find buttons to switch between "Current month" and "Previous month". This allows you to easily compare the costs of the previous month with the current month.
The information is displayed in a table with the following columns:
Table Columns
- BRIN: The unique school code
- Name: The full name of the school
- Address: The address of the school
- Postal Code: The postal code of the school
- City Name: The location where the school is situated
- Staff: The number of registered staff members of the school
- Students: The number of registered students of the school
- Costs: The total OpenAI API costs for this school in the current month
Cost Calculation per School
The costs per school are not the actual costs, but a calculated distribution based on the number of users per school. The calculation works as follows:
Costs per school = (Number of school users / Total number of users) × Total AI costs
Where the number of users consists of students + staff members per school.
Total Costs
At the top of the dashboard, you see the total AI costs of the current month, broken down by provider:
- Total: The sum of all costs (for example $16.52)
- OpenAI: Total costs for OpenAI models (for example $15.18)
- Anthropic: Total costs for Anthropic models (for example $1.10)
- Google: Total costs for Google models (for example $0.24)
This total amount is distributed across all schools based on their number of users.
We count the total of input tokens, output tokens, or other relevant data per model to arrive at the total monthly costs.