Chats dashboard
Via the "Chats" tile, you get insight into the AI costs and usage of your environment for the current month.
Tabs
The dashboard is divided into three tabs:
- Costs: Total AI costs per provider and per school
- Analysis: Breakdown by usage type, top schools and most used models
- Budgets: Set thresholds for cost alerts
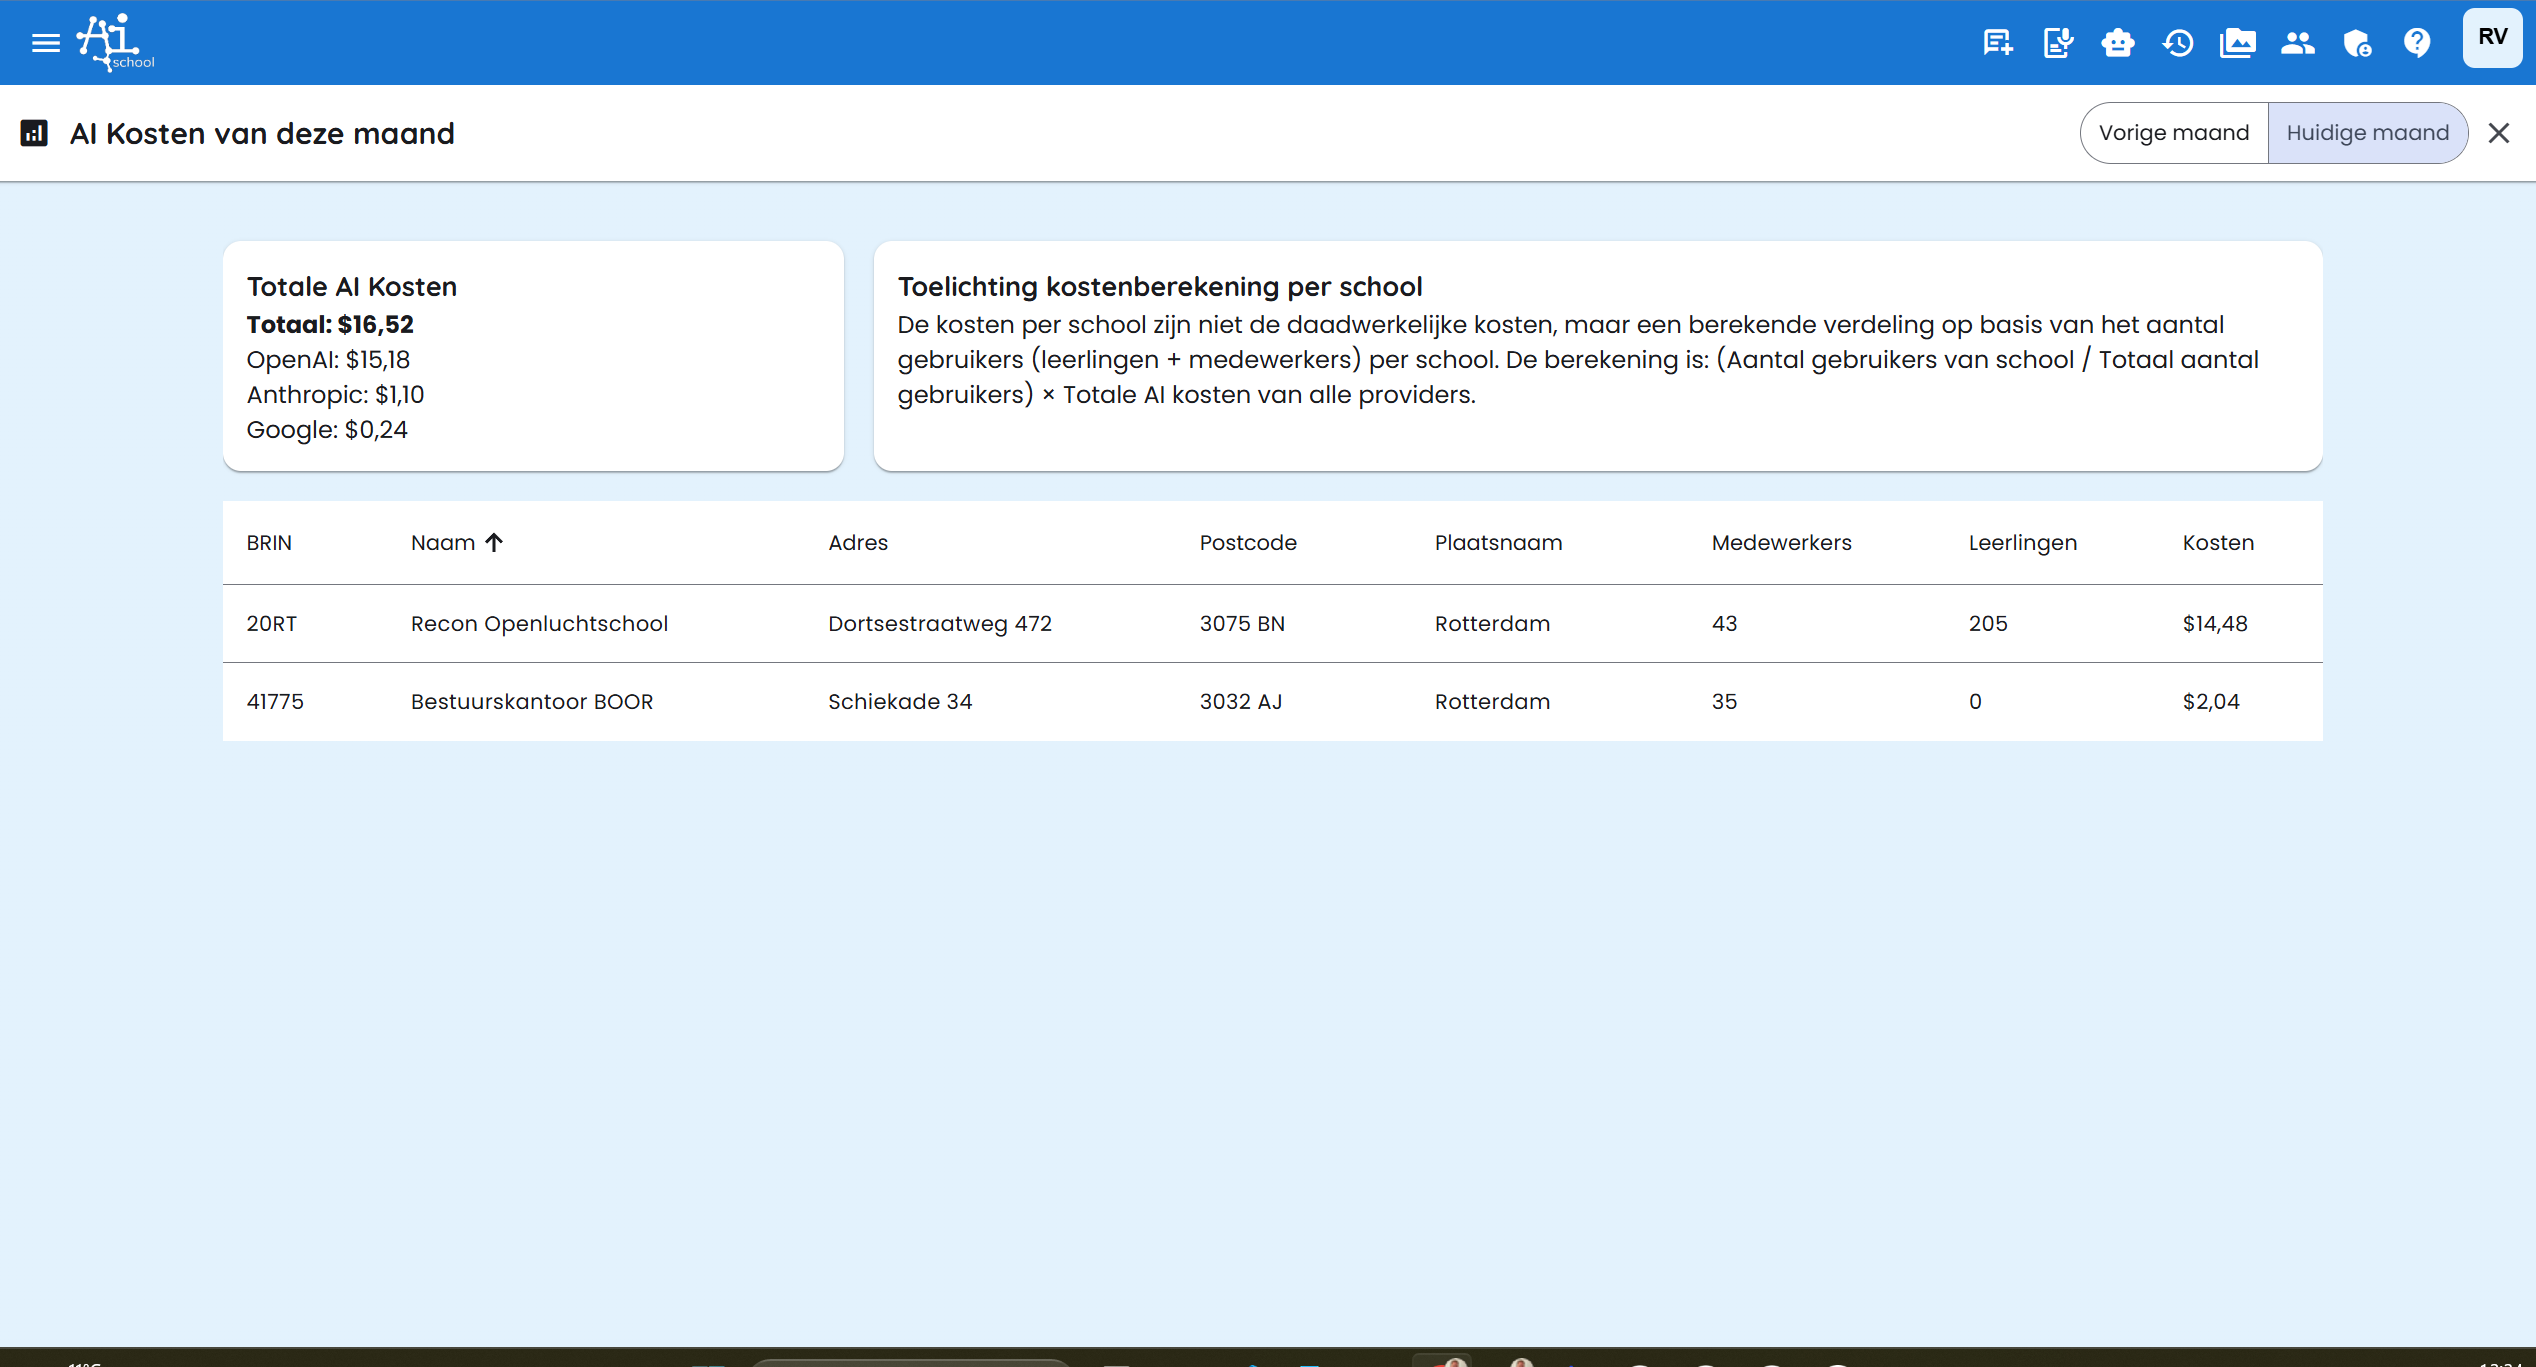
Tab: Costs
Current or previous month
At the top of the dashboard you can switch between Current month and Previous month. This makes it easy to compare costs across two periods.
Cost overview per provider
The cost overview shows the total costs broken down by AI provider, each with their own logo:
- OpenAI — GPT models and GPT Image image generation
- Anthropic — Claude models
- Google — Gemini models (text, image and speech)
- Mistral — Mistral language models
- Black Forest Labs — FLUX image generation models
Each provider is only shown if there are costs for that period.
Fetch error
If fetching costs for a provider fails (for example due to a temporary API error), you will see an orange warning icon (⚠) next to the provider name. Hover over the icon to view the error message. The total amount may then be incomplete — the costs for that provider are missing.
Budget usage
If a budget has been set for the environment, you will see a progress bar below the total amount indicating what percentage of the budget has been used. The colour changes as usage increases:
- Blue: Normal usage
- Yellow/orange: More than 80% used
- Red: Budget exceeded (100%+)
Cost distribution per school
The table at the bottom shows the estimated costs per school. The distribution is based on actual usage per school (from analytics), or — if that data is not available — on the share of users:
Costs per school = (Number of school users / Total number of users) × Total AI costs
Where the number of users consists of students + staff per school.
Tab: Analysis
The analysis tab provides a deeper insight into how costs are composed.
Usage by type
Costs are broken down by usage type:
- Text: Costs for chat messages (language models)
- Image: Costs for generated images
- Speech: Costs for voice chat (Gemini Live)
For each type you can see both the costs and the number of messages.
Top schools by cost
A list of the five schools with the highest costs in the selected period.
Most used models
A list of the five most used AI models, with costs and message count.
Tab: Budgets
In the Budgets tab you set thresholds for cost alerts. This requires sufficient permissions (superadmin or apiSleutels write permission).
Thresholds
Two thresholds are available:
| Threshold | Description |
|---|---|
| Warning threshold | Costs at which a warning notification is sent |
| Critical threshold | Costs at which a critical notification is sent |
If you set the critical threshold to 0, that threshold is disabled.
If you leave the threshold at 0, the system automatically calculates a budget based on the number of schools and the education type (primary: €10/school, secondary/MBO: €25/school).
Saving budget settings is only possible for superadmins or users with write access to the API keys. Without these permissions, the fields are disabled and the save button is not visible.
Weekly email
Every week, the administrators of the environment receive an email with a summary of:
- The total AI costs of the current month
- The costs per provider
- A breakdown by usage type
- The top schools by cost
- The most used models
- Any threshold alerts
- The status of the automatic OpenAI key rotation
If fetching costs for a provider has failed, this is explicitly mentioned in the email so you know the total amount may be incomplete.